Technique Helps Predict Likelihood of Migraines in Concussion Patients
Shannon entropy (SE) analysis more accurately reveals mild traumatic brain injury (mTBI) than mean fractional anisotropy (FA), more accurately reveals those patients with mTBI who will develop post-traumatic migraines (PTM), and inversely correlates with time to recovery (TTR), according to new research published online in the journal, Radiology.
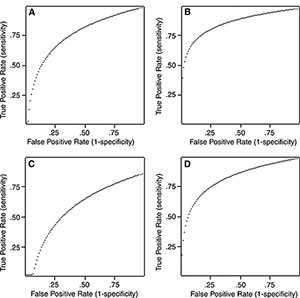
Joseph Delic, M.D., of the University of Pittsburgh Medical Center, and colleagues obtained FA maps and performed neurocognitive testing in 74 patients with mTBI. Mean FA and SE were correlated with clinical variables and were used to determine the areas under the receiver operating characteristic curve (AUCs) and likelihood ratios for mTBI and development of PTM.
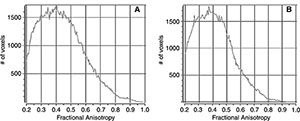
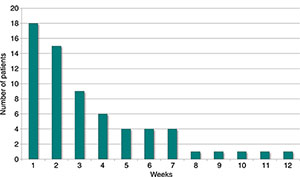
SE analysis of whole-brain FA histograms demonstrated outstanding diagnostic performance for distinguishing patients who have suffered a true concussive injury from control subjects and was further able to help distinguish those patients with mTBI with PTM. Lower SE also correlated with increased recovery time in patients with mTBI.
Based on information theory, SE measures the complexity of a data set. The larger the amount of information or complexity contained in a data set, the more data points that are required to characterize the data set, and the higher the SE.
“Our study results suggest that SE analysis of FA histograms may better reflect the white matter pathologic conditions underlying mTBI and postconcussive symptoms and may have a role as a diagnostic tool and prognostic biomarker in individual patients with concussion,” the authors write.


Web Extras
- Access the study, "White Matter Injuries in Mild Traumatic Brain Injury and Posttraumatic Migraines: Diffusion Entropy Analysis," at pubs.rsna.org/doi/full/10.1148/radiol.2015151388